
How to Read Lithium Battery Discharge Curve and Charging Curve
Lithium batteries are widely used in electric vehicles, consumer electronics, power tools, and energy storage systems. Understanding the lithium battery discharge curve and charging curve is essential for evaluating battery performance, efficiency, lifespan, and safety.
By analyzing voltage, current, capacity, and state of charge (SOC), users can better understand how lithium-ion batteries behave under different operating conditions. This guide explains how to read lithium battery curves and how they help optimize battery performance.
What Is a Lithium Battery Discharge Curve?
A lithium battery discharge curve represents how battery voltage changes during the discharge process. As stored energy is released, the voltage gradually decreases over time.
The discharge curve typically uses voltage as the vertical axis and time, capacity, SOC, or depth of discharge (DOD) as the horizontal axis.
Common Types of Discharge Curves
- Voltage vs. Time Curve
- Voltage vs. Capacity Curve
- Voltage vs. SOC Curve
- Voltage vs. Energy Curve
- Current vs. Time Curve
These curves help engineers and users evaluate battery stability, efficiency, and usable capacity.
Understanding Lithium-Ion Battery Discharge Characteristics
Low Discharge Rates
At lower discharge rates such as C/10, C/5, or C/2, the discharge curve declines gradually. This indicates stable power delivery and efficient capacity utilization.
High Discharge Rates
At higher discharge rates such as 1C, 2C, or 5C, the voltage drops faster due to increased internal resistance and polarization effects.
However, high-quality lithium batteries can still maintain a stable voltage plateau during high-current discharge.
How to Analyze a Lithium Battery Discharge Curve
1. Voltage Plateau Analysis
A flatter voltage plateau usually indicates better discharge stability and more consistent power output.
A steep voltage drop may suggest:
- Battery aging
- High internal resistance
- Heavy load conditions
- Poor battery quality
2. Discharge Capacity Evaluation
The area under the discharge curve directly relates to battery capacity, commonly measured in milliamp-hours (mAh) or ampere-hours (Ah).
A larger area under the curve indicates higher usable energy storage.
3. Internal Resistance Analysis
Internal resistance significantly affects battery efficiency and power output. Higher resistance causes faster voltage sag and increased heat generation.
By observing voltage drop behavior during discharge, users can estimate battery internal resistance and overall health.
4. Battery State of Health (SOH)
As lithium batteries age, their discharge curves gradually change. Signs of battery degradation include:
- Reduced capacity
- Shorter voltage plateau
- Faster voltage decline
- Higher internal resistance
5. Cycle Life Evaluation
Cycle life refers to the number of charge and discharge cycles a battery can complete before significant performance loss occurs.
Stable discharge curves over multiple cycles indicate good battery durability and longevity.
Factors That Affect Lithium Battery Discharge Curves
Battery Chemistry
Different lithium chemistries produce different discharge profiles. Examples include:
- Lithium Iron Phosphate (LiFePO4)
- Lithium Cobalt Oxide (LiCoO2)
- Lithium Manganese Oxide (LiMn2O4)
State of Charge (SOC)
Higher SOC values generally start with higher voltage levels.
Discharge Rate (C-Rate)
Faster discharge rates increase voltage drop and create steeper discharge curves.
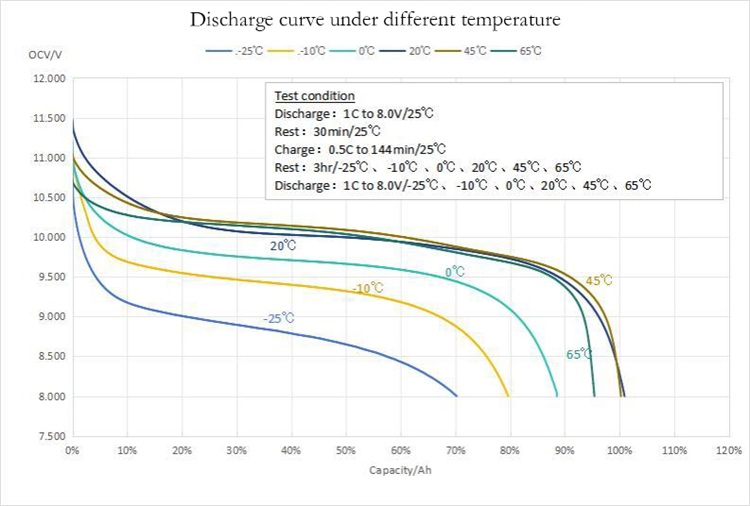
Temperature
Temperature strongly influences battery performance. Low temperatures increase internal resistance, while high temperatures accelerate battery degradation.
Battery Aging
Older batteries experience reduced capacity and increased resistance, which changes the discharge profile.
Load Conditions
Constant current, constant power, and variable loads all affect how the battery discharges.
What Is a Lithium Battery Charging Curve?
A lithium battery charging curve shows how battery voltage and current change during the charging process.
1. Constant Current (CC) Phase
During the initial stage, the charger supplies a constant current while battery voltage gradually increases.
2. Constant Voltage (CV) Phase
Once the battery reaches its target voltage, the charger switches to constant voltage mode. The current gradually decreases as the battery approaches full capacity.
3. Trickle or Float Charging Phase
Some charging systems apply a small maintenance current after full charging to compensate for self-discharge.
How to Analyze the Lithium Battery Charging Curve
Charging Speed Analysis
The slope of the charging curve reflects charging speed. Steeper slopes generally indicate faster charging capability.
Charging Efficiency
Charging efficiency measures how effectively electrical energy converts into stored chemical energy.
Higher charging efficiency reduces:
- Energy loss
- Heat generation
- Charging time
Charge Termination Voltage
The charge termination voltage defines when charging should stop. Proper voltage settings help prevent overcharging and extend battery lifespan.
Why Lithium Battery Curves Matter
Understanding lithium battery charging and discharge curves is critical for improving:
- Battery safety
- Energy efficiency
- Charging optimization
- Thermal management
- Battery lifespan
Battery curve analysis is widely used in electric vehicles, solar energy storage systems, industrial equipment, and portable electronics.
Frequently Asked Questions
What does a typical lithium battery discharge curve look like?
A typical curve begins with a relatively flat voltage plateau, followed by a gradual decline and a rapid voltage drop near the end of discharge.
Why is the voltage plateau important?
The voltage plateau indicates stable power delivery and consistent battery performance.
How does discharge rate affect the curve?
Higher discharge rates create larger voltage drops and steeper discharge curves.
Can temperature affect battery curves?
Yes. Low temperatures increase internal resistance, while high temperatures accelerate battery aging.
How can discharge curves improve battery life?
Monitoring discharge behavior helps users avoid deep discharge, overheating, and improper charging practices.
Conclusion
Lithium battery discharge curves and charging curves provide valuable insights into battery performance, efficiency, and long-term reliability.
By understanding voltage plateaus, charging phases, internal resistance, and cycle life behavior, users can optimize battery management systems and extend battery lifespan.
Whether used in electric vehicles, renewable energy systems, or consumer electronics, proper battery curve analysis plays a critical role in maximizing safety and operational efficiency.